
“If you can’t measure it, you can’t improve it,” is a truism in business. The corollary principle is that you get what you measure. People are human: when time is short and pressure is on, they’ll focus on delivering the metrics that business values.
DevOps leaders know how important it is to avoid relying on a single metric like deployment frequency, which could lead to a team that values speed over quality.
Here are four key metrics that can help guide and improve the practice of lean and DevOps development teams:
- Release count
- Lead time
- Change failure rate
- Mean time to recover
Let’s take a look at what the recent State of DevOps report has to say about how high-performing teams measure up on these metrics:
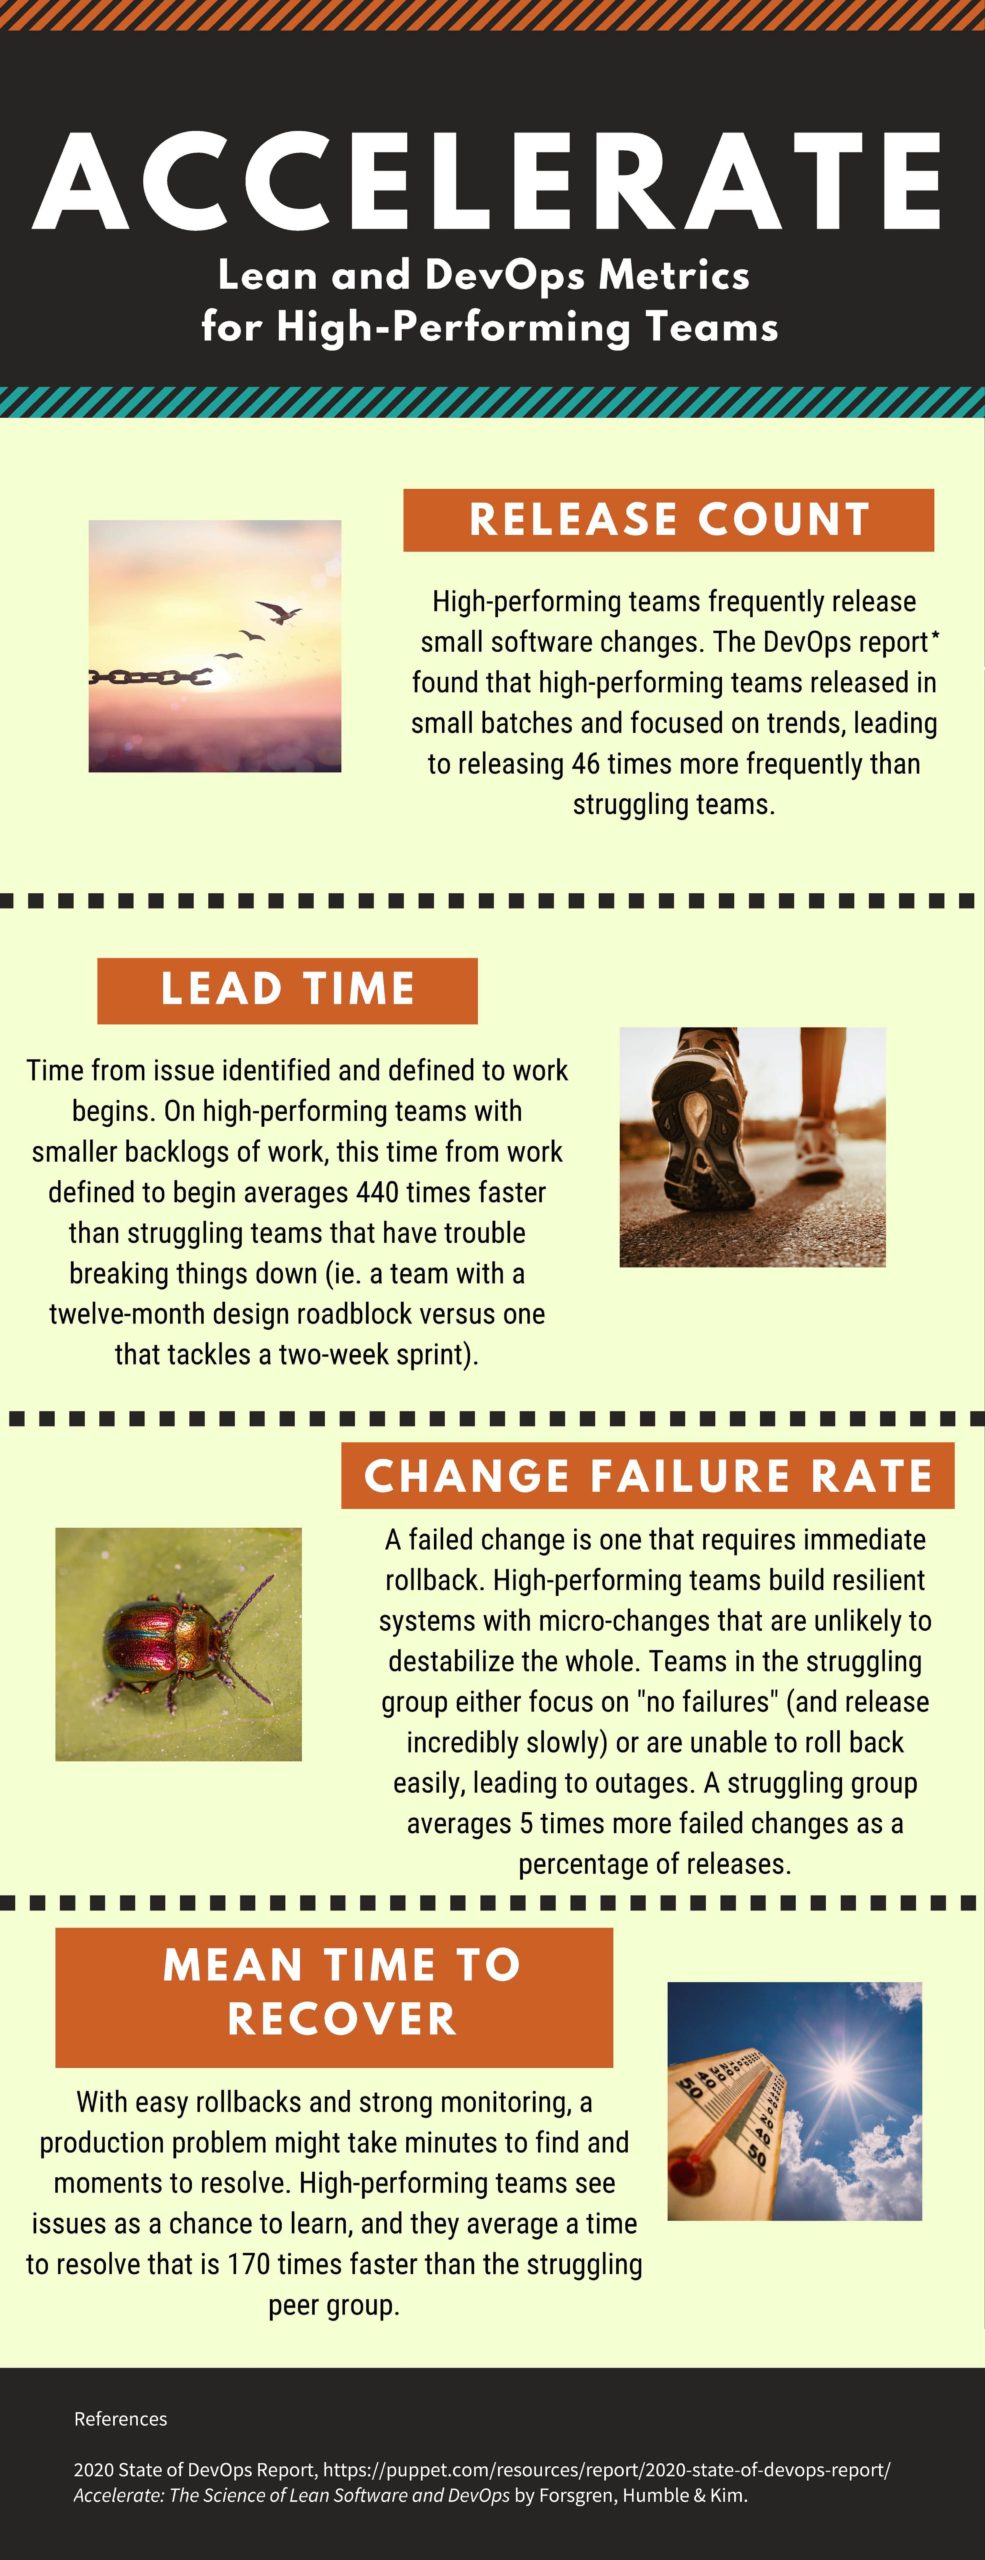
Release Count: High-performing teams frequently release small sofware changes. The DevOps report found that high-performing teams released in small batches and focused on trends, leading to releasing 46 times more frequently than struggling teams.
Lead time: Time from when the issue identified and defined, to when work begins. On high-performing teams with smaller backlogs of work, this time from work defined to begin averages 440 times faster than struggling teams that have trouble breaking things down (i.e., a team with a twelve-month design roadblock versus one that tackles a two-week sprint).
Change failure rate: A failed change is one that requires immediate rollback. High-performing teams build resilient systems with micro-changes that are unlikely to destabilize the whole. Teams in the struggling group either focus on “no failures” (and release incredibly slowly) or are unable to roll back easily, leading to outages. A struggling group averages 5 times more failed changes as a percentage of releases.
Mean time to recover: With easy rollbacks and strong monitoring, a production problem might take minutes to find and moments to resolve. High-performing teams see issues as a change to learn, and they average a time to resolve that is 170 times faster than the struggling peer group.
All-in-one Test Automation
Cross-Technology | Cross-Device | Cross-Platform